> ## Documentation Index
> Fetch the complete documentation index at: https://docs.zerorank.ai/llms.txt
> Use this file to discover all available pages before exploring further.
# Monthly reports
> A tidy monthly summary you can download as a PDF and share.
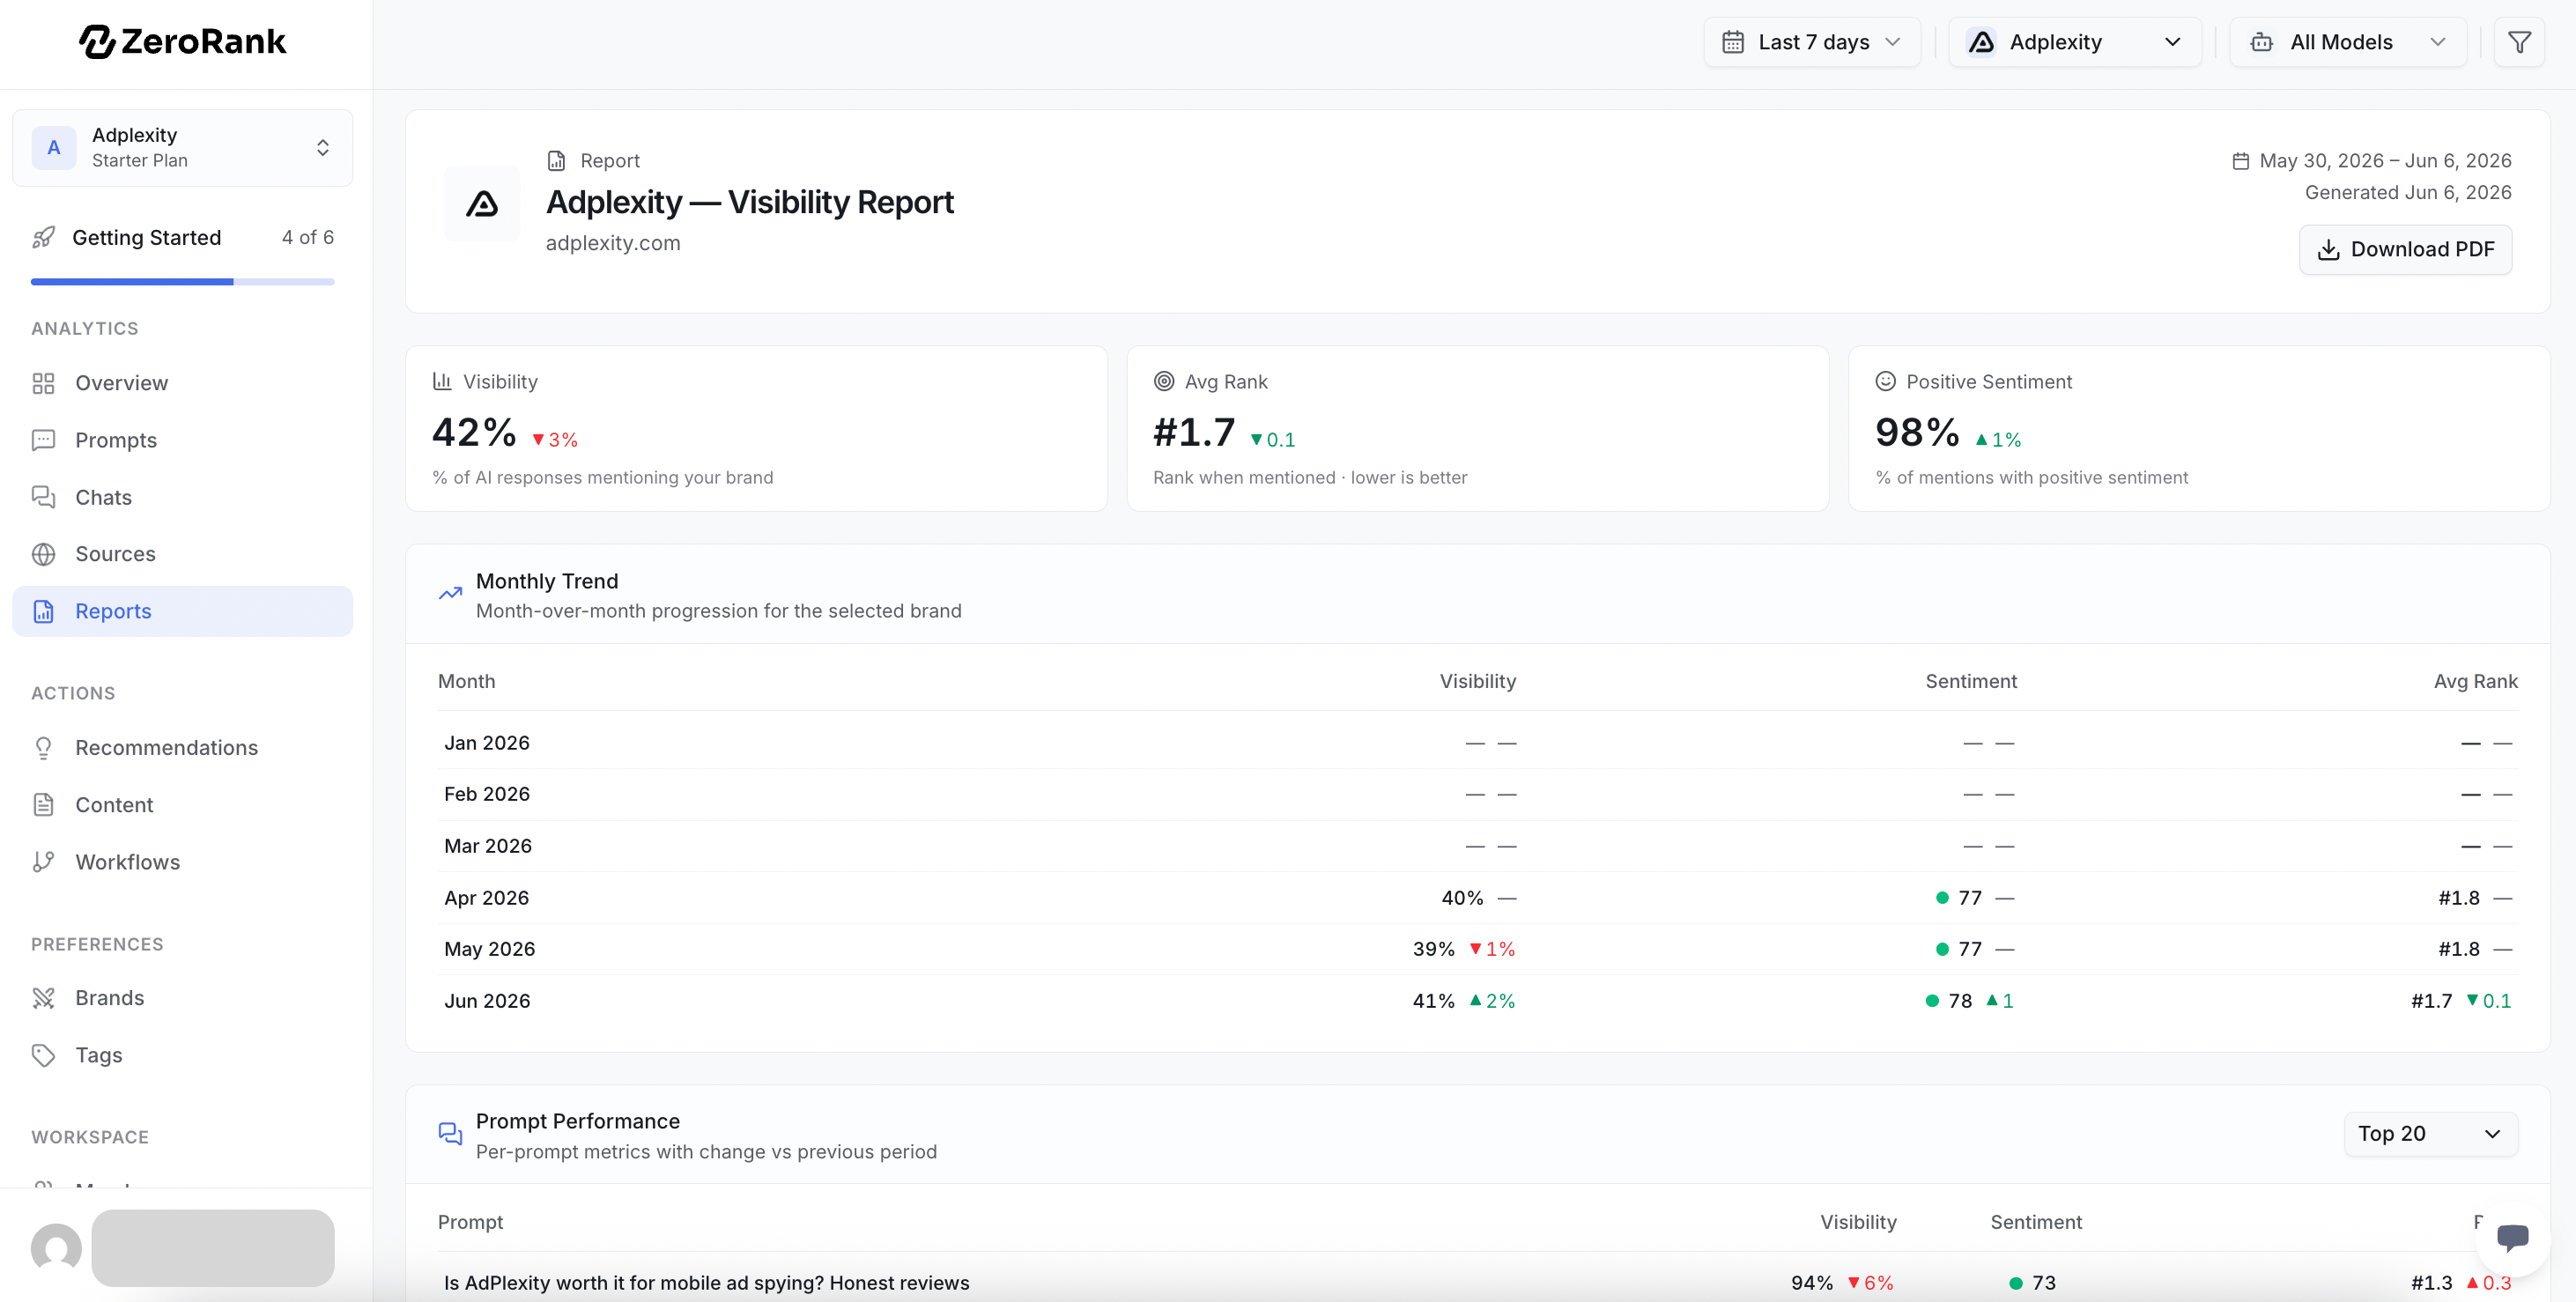
A monthly report is a neat snapshot of how your brand did in AI answers. It pulls your most important numbers into one page. You can read it on screen, save it as a PDF, and send it to your team or your boss.
The report always compares two time windows: this period and the one before it. That way you can see what went up and what went down.
 ## What is inside the report
The report has 9 parts, always in the same order.
The three headline numbers up top. They are your [visibility score](/start/glossary) (the share of AI answers that mention your brand), your average rank, and the share of mentions that were positive. KPI is short for key performance indicator. That just means "a number worth watching."
A list of your brand next to your competitors. Each one shows its visibility, its rank, and its [sentiment](/start/glossary) (whether the AI talked about you in a good, okay, or bad way). It also shows how each of those changed since last period.
A line chart that shows the visibility trend over time, with one line per brand. You can see who is climbing and who is slipping.
A simple timeline of how many [chats](/start/glossary) (the answers an AI engine gave back) ran each day. It helps you spot busy days and quiet days at a glance.
A table with one row per [prompt](/start/glossary) (a question we ask AI engines for you). Each row shows the prompt's volume (how many chats ran), visibility, average position, mentions, and sentiment.
The biggest movers in one place: your top 3 gainers (prompts where visibility rose the most) and your top 3 decliners (where it fell the most).
How many mentions were positive, neutral, and negative, with the count for each. It also shows how those counts changed from last period.
A 6-month view of visibility, sentiment, and average position. It shows the bigger story behind the day-to-day ups and downs.
The exact dates being compared: the start and end of this period, and the start and end of the period before it. This tells you what "change" is measured against.
Most numbers in the report come with a change next to them. A change is the difference from the period before, so you can tell if things got better or worse.
## How to export a PDF
Go to [app.zerorank.ai](https://app.zerorank.ai) and open the **Reports** page.
Make sure you are looking at the right brand and the right dates.
Use the export option on the page. ZeroRank turns the report into a PDF file.
The PDF downloads to your computer. Now it is yours to keep and share.
## How to share it
Once you have the PDF, you can share it like any other file. Email it to your boss, drop it in a team chat, or add it to a slide deck. It reads well on its own, so the person who gets it does not need a ZeroRank login.
Send the same report each month. Lined up side by side, the PDFs make your progress easy to see.
## Keep going
See your live numbers any day, not just at month's end.
Learn what the share-of-answers number really means.
## What is inside the report
The report has 9 parts, always in the same order.
The three headline numbers up top. They are your [visibility score](/start/glossary) (the share of AI answers that mention your brand), your average rank, and the share of mentions that were positive. KPI is short for key performance indicator. That just means "a number worth watching."
A list of your brand next to your competitors. Each one shows its visibility, its rank, and its [sentiment](/start/glossary) (whether the AI talked about you in a good, okay, or bad way). It also shows how each of those changed since last period.
A line chart that shows the visibility trend over time, with one line per brand. You can see who is climbing and who is slipping.
A simple timeline of how many [chats](/start/glossary) (the answers an AI engine gave back) ran each day. It helps you spot busy days and quiet days at a glance.
A table with one row per [prompt](/start/glossary) (a question we ask AI engines for you). Each row shows the prompt's volume (how many chats ran), visibility, average position, mentions, and sentiment.
The biggest movers in one place: your top 3 gainers (prompts where visibility rose the most) and your top 3 decliners (where it fell the most).
How many mentions were positive, neutral, and negative, with the count for each. It also shows how those counts changed from last period.
A 6-month view of visibility, sentiment, and average position. It shows the bigger story behind the day-to-day ups and downs.
The exact dates being compared: the start and end of this period, and the start and end of the period before it. This tells you what "change" is measured against.
Most numbers in the report come with a change next to them. A change is the difference from the period before, so you can tell if things got better or worse.
## How to export a PDF
Go to [app.zerorank.ai](https://app.zerorank.ai) and open the **Reports** page.
Make sure you are looking at the right brand and the right dates.
Use the export option on the page. ZeroRank turns the report into a PDF file.
The PDF downloads to your computer. Now it is yours to keep and share.
## How to share it
Once you have the PDF, you can share it like any other file. Email it to your boss, drop it in a team chat, or add it to a slide deck. It reads well on its own, so the person who gets it does not need a ZeroRank login.
Send the same report each month. Lined up side by side, the PDFs make your progress easy to see.
## Keep going
See your live numbers any day, not just at month's end.
Learn what the share-of-answers number really means.